overlay an image onto another one

TL;DR; Use the below code to insert one image onto another at a fixed position (scaled down).

The code below draws an image onto another existing picture. The use case is straight forward: Insert a logo or similar at a fixed position or similar to enhance your figures. As always, check out the related gist on my GitHub which contains the most up-to-date version.


def overlayimage(overlaypicture,
                 baseimg,
                 outfile='same',
                 # position in relative coordinates for icon/other image
                 position=[0.1, 0.1],
                 # scaling of image
                 width=0.2,
                 # scaling of image
                 height=0.2,
                 # if the height/width do not fit the aspect
                 # of the image, adjust it automatically
                 keepaspect=True,
                 # the adjustment is by default for width, change to True
                 # to scale width instead
                 adjustheight=False,
                 # use the top corner (usual for images)
                 # set to False, as mainly we think from lower left as 0,0
                 # in science
                 fromtop=False,
                 # if outfile is not changed, input is required
                 # set force to change the original without checking
                 force=False,
                 ):

    import PIL

    if outfile == 'same':
        if not force:
            print('Are you sure you wan\'t to overlay it on the same picture?',
                  'Set force to suppress this warning')
            from time import sleep

            try:
                print("Press Ctrl+C within 10 seconds and then Y/N")
                for i in range(0, 10):  # waits 10 seconds
                    sleep(1)
            except KeyboardInterrupt:
                ans = input()
                if (ans.lower()[0] in ['y', 'j'] and 'n' not in ans.lower()):
                    force = True
                else:
                    print('There was an unrecognized character!',
                          'Are you sure you know how this works?',
                          'Let\'s try again...')
                    return overlayimage(overlaypicture,
                                        baseimg,
                                        position=position,
                                        width=width,
                                        height=height,
                                        keepaspect=keepaspect,
                                        adjustheight=adjustheight,
                                        fromtop=fromtop,
                                        force=force)

        if force:
            outfile = baseimg
        else:
            outfile = outfile.split('.')
            outfile[0] += '_overlay'
            outfile = '.'.join(outfile)

    if width > 1:
        width /= 100

    if height > 1:
        height /= 100

    position = [p / 100 if p > 1 else p for p in position]
    background = PIL.Image.open(baseimg)
    foreground = PIL.Image.open(overlaypicture)
    if keepaspect:
        if adjustheight:
            height *= foreground.height / foreground.width
        else:
            width *= foreground.width / foreground.height
        foreground = foreground.resize((int(width*background.width),
                                        int(height*background.height)),
                                       PIL.Image.LANCZOS)
    else:
        foreground = foreground.resize((int(width*background.width),
                                        int(height*background.height)),
                                       PIL.Image.LANCZOS)

    # 4-tuple defining the left, upper, right, and lower pixel corners
    # since we usually define this from lower left but images are from upper
    # left the proper position is 1-height-ypos
    pos = [int(position[0]*background.width),
           int((1-position[1]-height)*background.height)]

    background.paste(foreground, pos, foreground)
    background.save(outfile)
    return outfile


if __name__ == '__main__':
    print('*'*10, 'HELP for overlayimage', '*'*10)
    print('Put another picture into one that already exists')
    print('Outputfile is by default the same and position is 20%',
          'and starts from lower left corner but can be adjusted as needed')

The idea is to enhance your graph with a logo or icon that portrays better for what is shown, e.g. insert an animal or similar instead of just text for you tickmarks. While this could be done manually, that feels too tedious if you have to do it many times. As this utility edits saved images, it uses PIL to handle the opening/closing/adding the image.

The usage is relatively straightforward, pass in the two filenames, first the one that is the image to be overlain and second the existing image. If you are certain the placement (whatever you enter for the position, default 10% from top and 10% from left as this is in image coordinates) is fine, you can overwrite the file in place (outfile=’same’). I recommend trying out first what you want to add where. Ideally, this utility is either combined with images that all have the same layout or you get the position directly from a script where you create your images.

Generally, the aspect of the image to be overlain is kept the same and the width is scaled accordingly but this can also be changed via keyword. Hope this helps someone out there.
My implementation of a touchdown event via javascript

TL;DR; The below code can be added as a script to your page to implement a touchdown event detection and directly attach it to a “menu” element

async function swipedetect(el, callback, threshold=50, minimumTime=150, allowedTime=2000){

    var touchsurface = el,
    swipedir,
    startX,
    startY,
    distX,
    distY,
    threshold = threshold, //required min distance traveled to be considered swipe in X
//    restraintX = restraintX, // maximum distance allowed at the same time in perpendicular direction in X
//    thresholdY = thresholdY, //required min distance traveled to be considered swipe in Y
//    restraintY = restraintY, // maximum distance allowed at the same time in perpendicular direction in Y
    minimumTime = minimumTime, // maximum time allowed to travel that distance
    allowedTime = allowedTime, // maximum time allowed to travel that distance
    elapsedTime,
    startTime,
    handleswipe = callback || function(swipedir){}

    touchsurface.addEventListener('touchstart', function(e){
        var touchobj = e.changedTouches[0]
        swipedir = 'none'
        dist = 0
        startX = touchobj.pageX
        startY = touchobj.pageY
        startTime = new Date().getTime() // record time when finger first makes contact with surface
        // e.preventDefault()
    }, false)

    touchsurface.addEventListener('touchmove', function(e){
        e.preventDefault() // prevent scrolling when inside DIV
    }, false)

    touchsurface.addEventListener('touchend', function(e){
        var touchobj = e.changedTouches[0]
        distX = touchobj.pageX - startX; // get horizontal dist traveled by finger while in contact with surface
        distY = touchobj.pageY - startY; // get vertical dist traveled by finger while in contact with surface
        dist = distY * distY + distX * distX;
        dist = Math.sqrt(dist);
        elapsedTime = new Date().getTime() - startTime; // get time elapsed
        // calculate the angle of the movement
        angle = (Math.atan2(distY, distX) / Math.PI * 180)
        // convert angle to a sector of the movement
        // offsetting it by 45 degreees to get the movement easier.
        // and ensuring its positive
        sector = (angle + 45 + 360) % 360;
        sector = Math.floor(sector/90);
        if (elapsedTime >= minimumTime && elapsedTime <= allowedTime && dist >= threshold){ // first condition for a swipe met
            switch (sector) {
               case 0: swipedir = "right"; break;
               case 1: swipedir = "up"; break;
               case 2: swipedir = "left"; break;
               case 3: swipedir = "down"; break;
            }
        }
        handleswipe(swipedir)
        if (dist >= threshold) {
          e.preventDefault()
        }
    }, false)
}

async function swipe_enable(elementid='menu', table={'right':'a', 'up':'w', 'left':'d', 'down':'s', 'none': null}) {
  var el = document.getElementById(elementid);
  if (el) {
    swipedetect(el, async function(swipedir){
      //swipedir contains either "none", "left", "right", "top", or "down"
      let key = table[swipedir];
      document.dispatchEvent(new KeyboardEvent('keypress', {'key': key}));
    })
  }
}

Handling a touchdown event via vanilla JS is nothing new, and I also took the initial implementation from a website I cannot find anymore. The structure was similar to this gist and the related discussion, as in initially I simply added a touchdown but the detection of right/left/up/down was patchy until I also added the direction sector. Additionally, I did not want to attach it all the time to each element etc. but instead added another function that handles the attaching.

Now I can simply have the above in a js-lib file and source it on our data visualisation page, then call swipe_enable() in the doc.ready function and be certain that swiping is handled on the corresponding element (with selects in this case). This makes usage of the page far easier on mobile devices; highly relevant if you are in the field like in CLOUDLAB and your phone is the only thing available due to the windy/rainy/snowy weather.

geo utils – get altitude profile data from swisstopo

Summary & code

Use the swisstopo API to get a profile of altitudes with the function get_swisstopo_elevation_profile by passing coordinates aka “Rechtswert” and “Hochwert” as array/list (any iterable should do). The gist on GitHub should always be the most up-to-date version

Python
def get_swisstopo_elevation_profile(coords,  # a path (2+ points in the form)
                                    kind='csv',
                                    # three heights are available for JSON
                                    # COMB, DTM2, DTM25
                                    which='COMB',
                                    asnumpy=True,
                                    quiet=True,
                                    opts={"sr": None,
                                          "nb_points": None,
                                          "offset": None,
                                          "distinct_points": True,
                                          "callback": None,
                                          }
                                    ):
    """
    Call the swisstopo API for altitude data along a path.

    Pass in a list or array of coordinates in EPSG 2056 (LV95) or 21781 (LV03)
    to get altitude values along the provided path. For options see keywords or
    parameters of call via swisstopo API.

    Parameters
    ----------
    coords : list or numpy array
        The coordinates in either EPSG 2056 (LV95) or EPSG 21781 (LV03).
    kind : str, optional
        Which API backend should be queried. Available are json and csv.
        If none of these are passed properly, fallback is csv.
        The default is 'csv' (easier structure to parse).
    which: str
        If kind is json, three altitude values are available, DTM2, DTM25 and
        COMB(INATION).
    asnumpy : bool, optional
        Whether to return a numpy array.
        The default is True.
    quiet : bool, optional
        Whether to quiet the output (True) or not.
        The default is True.
     opts: dict
        Further keywords than can be passed to the API call, see
        https://api3.geo.admin.ch/services/sdiservices.html#profile

    Returns
    -------
    list or numpy array
        The returned points, in the form of distance along path, altitude,
        coordinates.

    """

    import requests
    import numpy as np

    if len(coords) > 5000:
        print('Warning, number of coordinates exceeds swisstopo API'
              'max number of points, reduce coords beforehand.')
        return np.asarray([]) if asnumpy else []

    payload = 'geom={"type":"LineString","coordinates":['
    payload += ','.join([f"[{coord[0]},{coord[1]}]"
                         for coord in coords])
    payload += ']'
    opts = ','.join(['"'+str(key)+'"'+':'+'"'+str(opt)+'"'
                     for key, opt in opts.items()
                     if opt is not None])
    if opts:
        payload += ',' + opts
    payload += '}'
    kind = kind.lower()
    if kind.lower() not in ['csv', 'json']:
        if not quiet:
            print('Only csv or json can be chosen, autoselecting csv')
        kind = 'csv'

    baseurl = "https://api3.geo.admin.ch/rest/services/profile." + kind
    try:
        profile = requests.get(baseurl, params=payload)
    except ConnectionError:
        if not quiet:
            print('Connection timeout')
        return np.asarray([]) if asnumpy else []

    if profile.ok:
        if not quiet:
            print('Success')
    else:
        if not quiet:
            print('Failed')

    if kind == 'csv':

        profile = profile.text.split('\r\n')
        # Distance, Altitude, Easting, Northing -> not needed
        # header = profile[0]
        profile = list(map(lambda x: [float(j.strip('"'))
                                      for j in x.split(';')],
                           profile[1:-1]))
    elif kind == 'json':

        profile = [[p['dist'], p['alts'][which],
                    p['easting'], p['northing']]
                   for p in profile.json()]

    if asnumpy:
        profile = np.asarray(profile)

    return profile


if __name__ == '__main__':
    # straightforward example usage
    rw=[2611025.0, 2620975.0, 2633725.0]
    hw=[1266400.0, 1256750.0, 1250000.0]
    profile = get_swisstopo_elevation_profile(list(zip(rw, hw)))
    import matplotlib.pyplot as plt
    plt.fill_between(profile[:,0], 
                     profile[:,1], 
                     facecolor='grey',
                     edgecolor='k',
                     alpha=0.8)
    plt.ylim(min(profile[:,1]), None)

Background/motivation

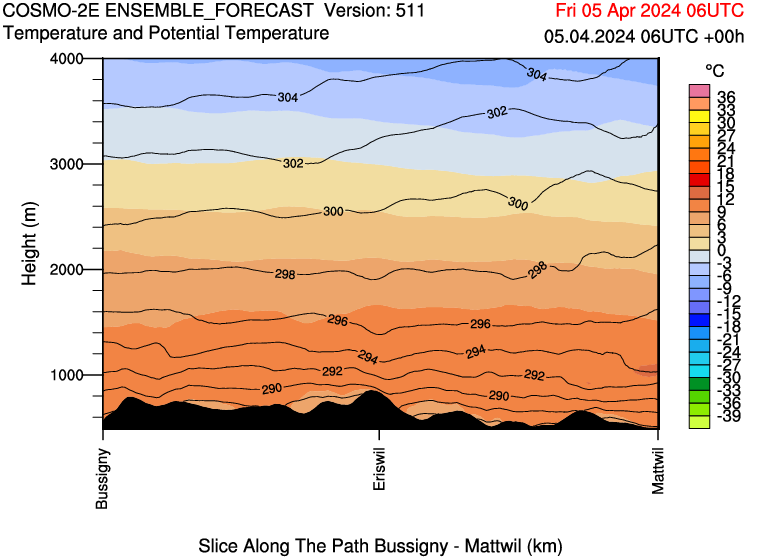
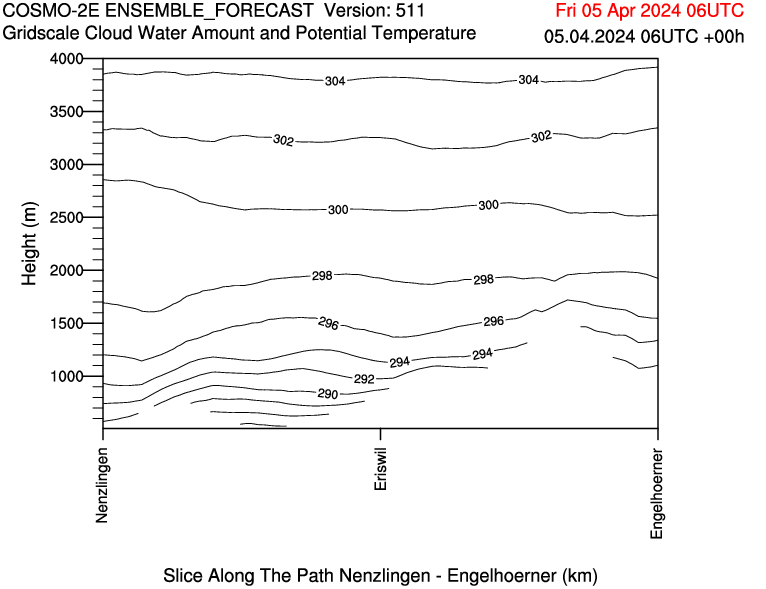
For the CLOUDLAB project we regularly get forecasts that contain a profile at the bottom of the figure from MeteoSwiss that illustrates the terrain nicely (albeit, sometimes it is missing for unknown reasons):

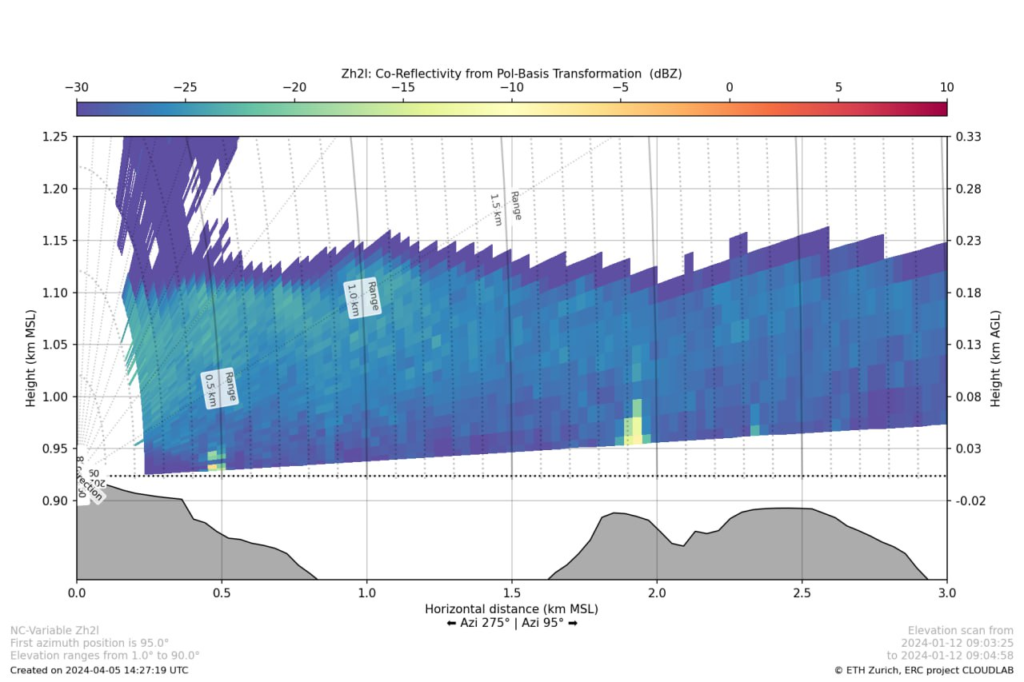
Similarly, I produced a lot of figures of our scans and depending on azimuth and elevation they may be affected by ground clutter, e.g. at a distance of 2 km the increased reflectivity is caused by the terrain below (the hill at around 800 m above sea level). As you can see, I added the terrain already.

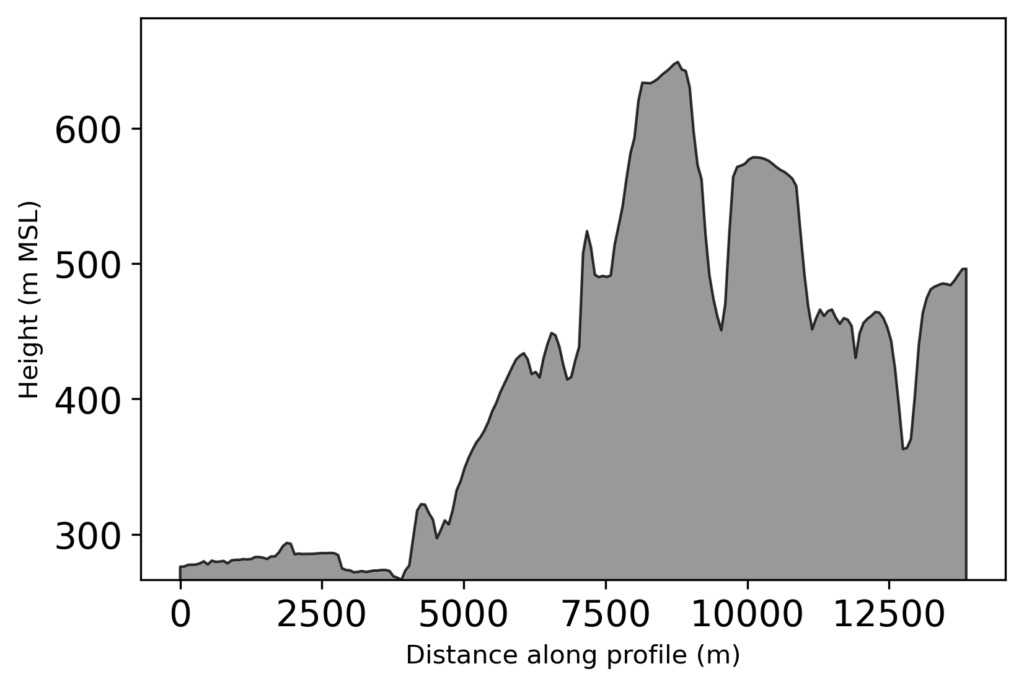
Initially, I thought I’d have to get the actual DEM for the area, find the path matching the scan direction and calculate the profile myself. While this might actually be a bit more accurate with a good DEM, it would be more work, not be transferable and mean I’d have to have extra data around. Instead, I realized that swisstopo offers the measure tool on map.geo.admin.ch and uses their own API with a matching request. So I choose to use this as I’m already adding the coordinates for the scan and it is relatively straightforward (min/max of lowest elevation scanline) to get the path we need. The main issue I faced was a misformatted quote that came from copy-pasting the swisstopo example. After finally figuring this out after a detailed URL decode and string comparison the function is relatively lean and can use either the JSON or the CSV backend of the API and by default gives you out a numpy array which can be visualized with ease and can look as follows:

I hope this helps someone to get a profile to enrich their Python (or other) graphs when measuring in Switzerland. In the likely case that you aren’t doing something in Switzerland it might be worthwhile to check out the Google Maps Elevation API (for which you need an API key and billing enabled)