When getting swisstopo altitude profiles the response time is in general quite good but just sometimes I ran into timeouts, be it due to my bad connection or too many requests to the server. To amend I added this decorator that you can get as the most up-to-date version from my GitHub gists to the original swisstopo function (or other functions that might run into some form of timeout)
defexponential_retry(max_retries, delay):"""Retry a request with exponentially increasing (slightly random) time in between tries""""""Usage before def of another function via @exponential_retry(5, 1) """defdecorator_exponential_retry(func):import functools@functools.wraps(func)defwrapper_exponential_retry_decorator(*args, **kwargs):import random retries =0while retries <= max_retries:try:return func(*args, **kwargs)exceptExceptionas e:print(f"Attempt {retries +1} failed: {e}") retries +=1 sleeptime = (delay *2** retries + random.uniform(0, 1))print(f"Retrying in {sleeptime:.2f} seconds...") time.sleep(sleeptime)raiseException("Maximum amount of retries reached, too many timeouts/errors.")return wrapper_exponential_retry_decoratorreturn decorator_exponential_retry@exponential_retry(5, 1)defget_swisstopo_elevation_profile(...): .# source code of get_swisstopo_elevation_profile...
VPN clients are often used to get access to internal infrastructure. Often I had to use them to enter time tracking, connect to servers or similar. However, on my usual device running Linux, after I was done I’d disconnect after I was done – however, internet connectivity wasn’t working properly afterwards (despite being connected). This was usually an issue of resolving addresses and not per see a connection issue. The above one line restarts the systemd resolver, meaning I’d get back the connection when running. Hope this helps somebody that faces the same issue.
Get the census data (and more) from the Basler Atlas that are updated by the Statistisches Amt Basel. The up-to-date version can be found on my GitHub Gists. Don’t forget to add the data source, i.e. the Stat. Amt Basel when you use their data. – it is being added automatically to the “meta” part in the datacontainer (in addition to the URL, the name and short name of the dataset).
import datetimeheaders = {'User-Agent': 'Mozilla/5.0'}defdata2csv(data,outpath='./',prefix='',suffix='',filesep='_',datasep=',',ext='.csv',quiet=True, ):import osifisinstance(data, dict) and'data'notin data.keys(): of = []for key in data.keys(): _of = data2csv(data[key],outpath=outpath,prefix=prefix,filesep=filesep,datasep=datasep,ext=ext,quiet=quiet, )ifisinstance(_of, list): of += _ofelse: of.append(_of)return of outpath = os.path.expanduser(outpath) filename = filesep.join([prefix, data['meta']['theme'], data['meta']['subtheme'], _nivgeo2nicename(data['meta']['nivgeo']), suffix, ]) filename = filename.lstrip(filesep).rstrip(filesep) + ext os.makedirs(outpath, exist_ok=True)ifnot quiet:print('Saving as', outpath+filename)withopen(outpath+filename, 'w') as file_obj: file_obj.writelines(datasep.join(data['header']) +'\n') datalines = [datasep.join(map(lambdax: str(x), line))for line in data['data']] file_obj.writelines('\n'.join(datalines) +'\n')return outpath+filenamedef_get_topic_url(): url ='https://www.basleratlas.ch/GC_listIndics.php?lang=de'return urldef_get_data_url():# used to be the first url at around 2018# "https://www.basleratlas.ch/GC_ronds.php?lang=de&js=1&indic=bevstruk.alter0&nivgeo=wge&ts=1&serie=2015" url ='https://www.basleratlas.ch/GC_ronds.php' url ='https://www.basleratlas.ch/GC_indic.php'return urldef_get_references_url():# e.g. https://www.basleratlas.ch/GC_refdata.php?nivgeo=wbl&extent=extent1&lang=de url ='https://www.basleratlas.ch/GC_refdata.php'return urldefget_ref_data(nivgeo, slimmed=True):import requests payload = {'nivgeo': nivgeo,'lang': 'de', 'extent': 'extent1'} refs = requests.get(_get_references_url(),params=payload,headers=headers) refdata = refs.json()['content']['territories']# contains the actual numbering in the main geographical administrative# dataset that it can be linked againstif slimmed:return refdata['libgeo'], refdata['codgeo']else:return refdatadef_replace_error_value(value, error_value, replace_value):return replace_value if value <= error_value else valuedefget_basler_atlas_data(nivgeo,theme,subtheme,year,quiet=True,error_value=-9999,replace_value=0,empty_value='', ):import requestsfrom requests.exceptions import JSONDecodeError payload = _params2payload(nivgeo, theme, subtheme, year=year) response = requests.get(_get_data_url(),params=payload,headers=headers)if response.ok:try: data = response.json()['content']['distribution']except JSONDecodeError:print(f'issues with {response.url} and the payload {payload}')returnNone, Noneifnot quiet:print(f'Got data from {response.url}, transforming ...') values = data['values']if'sortIndices'in data:# reported values are to be sorted, usual case? indices = data['sortIndices']else:# reported values are sorted already, usual case for Bezirk? indices =range(len(values))ifisinstance(values, dict): keys =list(values.keys()) indices =range(len(values[keys[0]])) values = [[_replace_error_value(values[key][i], error_value, replace_value, )for key in keys]for i insorted(indices) ] data = valuesreturn keys, dataelse: data = [str(_replace_error_value(values[i], error_value, replace_value, ) )for i insorted(indices)]returnNone, dataelse:ifnot quiet:print(f'Request for {payload} failed')returnNone, Nonedef_nivgeo2map(nivgeo): lookuptable = {'block': 'map5','wbl': 'map5','bezirk': 'map6','wbe': 'map6','viertel': 'map2','wvi': 'map2','gemeinde': 'map3','wge': 'map3',# 'wahlkreis': 'map7',# 'pwk': 'map7', }return lookuptable[nivgeo]def_get_nivgeos():return'wbe', 'wvi', 'wge', 'wbl'# , 'pwk'def_nicename2nivgeo(nivgeo=None): nicenames = _nivgeo2nicename(nivgeo=nivgeo)if nivgeo isNone:return {v: k for k, v in nicenames.items()}else:return {nicenames: nivgeo}def_nivgeo2nicename(nivgeo=None): names = {'wbe': 'bezirk','wvi': 'viertel','wge': 'gemeinde','wbl': 'block',# 'pwk': 'wahlkreis', }if nivgeo isNone:return nameselse:return names[nivgeo]def_params2payload(nivgeo,theme,subtheme,year=None): payload = {'lang': 'de','dataset': theme,'indic': subtheme,'view': _nivgeo2map(nivgeo), }if year isnotNone: payload['filters'] ='jahr='+str(year)return payloaddefget_basler_atlas(start_year=1998,end_year=datetime.date.today().year,# population has different ages,# men m , women w and a grand totalthemes={'bevstruk': ['alter0','alter20','alter65','w','m','gesbev'],'bevheim': ['anteil_ch','anteil_bs','anteil_al','anteil_bsanch',# "gesbev" has been replaced by'gesbev_f', ],'bau_lwg': ['anzahl_lwg', ], },geographical_levels='all',error_value=-9999,replace_value=0,testing=False,quiet=True, ): _nicenames = _nicename2nivgeo()if geographical_levels =='all': nivgeos = _get_nivgeos()else:ifisinstance(geographical_levels, str): geographical_levels = [geographical_levels] _nivgeos = _get_nivgeos() nivgeos = [i if i in _nivgeos else _nicenames[i]for i in geographical_levels]assertall([i in _nivgeos or i in _nicenamesfor i in nivgeos])# the defaults that we know of - there is wahlbezirke too on the# atlas but we don't particularly care about that one... data = {}# mapping of information from topic url to meta information entries info2meta = {'url': 'c_url_indicateur','name': 'c_lib_indicateur','short_name': 'c_lib_indicateur_court','unit': 'c_unite','source': 'c_source','description': 'c_desc_indicateur', }for nivgeo in nivgeos: refname, refnumber = get_ref_data(nivgeo) refdata = [[_refname, _refnumber]for _refname, _refnumber inzip(refname, refnumber)]# ids of the nivgeo is in refdata['codgeo']# names of the nivgeo is in refdata['libgeo'] nicename = _nivgeo2nicename(nivgeo)for theme in themes:ifnot quiet:print(f'Working on {theme} for {_nivgeo2nicename(nivgeo)}')for subtheme in themes[theme]:ifnot quiet:print(f'Working on {theme}.{subtheme} for ',f'{_nivgeo2nicename(nivgeo)}')# force a copy of refdata otherwise we keep updating the old list of lists. container = {'data': [i.copy() for i in refdata],'meta': {'theme': theme,'nivgeo': nivgeo,'subtheme': subtheme,'theme': theme, },'header': ['referencename', 'referencenumber'], } topicinfo = get_basler_atlas_topics(theme=theme,subtheme=subtheme,fullinfo=True)for key, value in info2meta.items(): container['meta'][key] = topicinfo[theme][subtheme][value]# values will be nested, adjust header line with extrafor year inrange(start_year, end_year+1):ifnot quiet:print(f'Getting data for {year} for {theme}',f'{subtheme} for {_nivgeo2nicename(nivgeo)}') keys, thisdata = get_basler_atlas_data(nivgeo, theme, subtheme, year,quiet=quiet, )if thisdata isNone:ifnot quiet:print(f'Failure to get data for {year} for {theme}',f'{subtheme} for {_nivgeo2nicename(nivgeo)}') thisdata = [''] *len(container['data'])if keys isNone: container['header'] += [f'{year}']else: container['header'] += [f'{year}_{key}'for key in keys]for i, value inenumerate(thisdata):ifnotisinstance(value, list): value = [value] container['data'][i] += valueif testing:break# year data[nicename+'_'+theme+'_'+subtheme] = containerif testing:break# specific themeif testing:break# themeif testing:break# nivgeoreturn datadefget_basler_atlas_topics(theme=None,subtheme=None,fullinfo=False):import requestsif subtheme isnotNoneandisinstance(subtheme, str): subtheme = [subtheme] payload = {"tree": "A01", 'lang': 'de'}if theme isnotNone: payload['theme'] = theme response = requests.get(_get_topic_url(),params=payload,headers=headers) topiclist = response.json()['content']['indics'] data = {}for topicinfo in topiclist: maintopic, subtopic = (topicinfo['c_id_dataset'], topicinfo['c_id_indicateur'])if maintopic notin data:if fullinfo: data[maintopic] = {}else: data[maintopic] = []if subtheme isnotNoneand subtopic notin subtheme:continueif fullinfo: data[maintopic][subtopic] = topicinfoelse: data[maintopic] += [subtopic]return dataif__name__=='__main__':print(""" Some example usages: # get some information for the population for the years 200 to 2003 data = get_basler_atlas(end_year=2003, start_year=2000, themes={'bevheim': ['anteil_ch','anteil_bs', ]}, geographical_levels='wvi', quiet=True) # just get everything that is a predefined topic: themes={'bevstruk': ['alter0', 'alter20', 'alter65', 'w', 'm', 'gesbev'], 'bevheim': ['anteil_ch', 'anteil_bs', 'anteil_al', 'anteil_bsanch', # "gesbev" has been replaced by 'gesbev_f', ], 'bau_lwg': ['anzahl_lwg', ], } # limit just by years data = get_basler_atlas(themes=themes, start_year=2000, end_year=2010) # also save the data to csv files (by theme and subtheme) data2csv(data) # get some information regarding the available topics themes = get_basler_atlas_topics()""")
In the years of 2014 to 2020 or so I was teaching “An introduction to Geoinformatics” at the University of Basel. As a starter, students were supposed to load data of the administrative units of Basel in the form of shapefiles into a GIS (ArcMap or QGIS, I gave support in both) and connect these with population data (age groups or similar). These data can be downloaded from the Statistisches Amt Basel, usually in the form of Excel sheets – which is doable for a GIS but not great to be used: Sometimes I even struggled with getting the right separator in the excel sheet to be automatically recognised for the later import (which is just one reason why I prefer QGIS). However, the updated numbers were sometimes published later than when I’d like to use them – even though the Basler Atlas already had them. So I went to work to scrape the data directly from this source, because I did not want to manually download the data each and every semester again and for several dataset individually. We can do better than that.
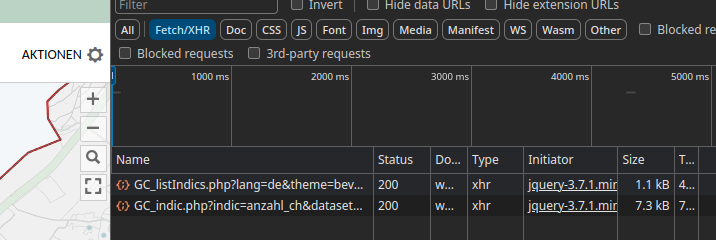
In the back, the Basler Atlas uses geoclip, a product from a French company (you also see their logo when opening the Atlas). Relevant for me was that with the browser inspect feature you can get the requests being made in the back and see where the data are coming from (you can of course also click on the request to see the direct answer)
As you can see there is a listIndics and a indic API endpoint. ListIndics gives an overview of datasets, indic gives the data of the “indices”. Both require some specific payload to work, the most important being {‘lang’: ‘de’}. There is however a third endpoint that gives the crucial reference information, namely the name/id of the administrative feature at GC_refdata.php. Initially, I only used the indic endpoint to collect the data directly and the ref to get the reference frame. Combining requests to both, the data can be collected automatically, either to update or for the first time and come back in dict, including a headerline and meta information for the later export (also included above). Now you can get your up-to-date data from the Basler Atlas as well and have a better time using it for temporal analysis by running the above code and then calling this or something like this
data = get_basler_atlas(geographical_levels='block',themes={'bevstruk': ['alter0','alter20','alter65','w','m','gesbev'], },quiet=True)
This gives you the population data on the block level of the years from 1998 until today (2024 as of this writing). Calling the below saves the data to your home directory, namely 6 CSV files.
data2csv(data, outpath='~/')
Today I extended the code above to also get the available topics (i.e. the categories). Which allows us to discover topics or download data that would require some time to find otherwise.
geolevel ='block'for key, values in topics.items():if key !='bevstruk':continue data = get_basler_atlas(themes={key: values},quiet=True,geographical_levels=geolevel) of = data2csv(data, outpath='~/')break
As always, I hope this helps someone to discover data or save some time for themselves. And maybe at some point, I’ll find the time to document everything a bit better. Don’t forget to add the data source, i.e. the Stat. Amt Basel when you use their data.
Update/Fix
As I noticed today, there was some issue with the previous version of this script, namely a “deepcopy” issue that led to the fact, that the datacontainer had data from all connected subthemes when more than one was requested. Ups. But it should be fine now, the gist on top is updated and some usage information is added as well. 🙂
TL;DR; Use the below code to insert one image onto another at a fixed position (scaled down).
The code below draws an image onto another existing picture. The use case is straight forward: Insert a logo or similar at a fixed position or similar to enhance your figures. As always, check out the related gist on my GitHub which contains the most up-to-date version.
def overlayimage(overlaypicture, baseimg, outfile='same', # position in relative coordinates for icon/other image position=[0.1, 0.1], # scaling of image width=0.2, # scaling of image height=0.2, # if the height/width do not fit the aspect # of the image, adjust it automatically keepaspect=True, # the adjustment is by default for width, change to True # to scale width instead adjustheight=False, # use the top corner (usual for images) # set to False, asmainlywethinkfromlowerleftas0,0 # in science fromtop=False, # if outfile is not changed, input is required # set force to change the original without checking force=False, ):import PIL if outfile == 'same': if not force: print('Are you sure you wan\'t to overlay it on the same picture?','Set force to suppress this warning')from time import sleep try: print("Press Ctrl+C within 10 seconds and then Y/N") for i in range(0, 10): # waits 10 seconds sleep(1) except KeyboardInterrupt: ans = input() if (ans.lower()[0] in ['y', 'j'] and 'n' not in ans.lower()): force = True else: print('There was an unrecognized character!','Are you sure you know how this works?','Let\'s try again...') return overlayimage(overlaypicture, baseimg, position=position, width=width, height=height, keepaspect=keepaspect, adjustheight=adjustheight, fromtop=fromtop, force=force) if force: outfile = baseimg else: outfile = outfile.split('.') outfile[0] += '_overlay' outfile = '.'.join(outfile) if width > 1: width /= 100 if height > 1: height /= 100 position = [p / 100 if p > 1 else p for p in position] background = PIL.Image.open(baseimg) foreground = PIL.Image.open(overlaypicture) if keepaspect: if adjustheight: height *= foreground.height / foreground.width else: width *= foreground.width / foreground.height foreground = foreground.resize((int(width*background.width), int(height*background.height)), PIL.Image.LANCZOS) else: foreground = foreground.resize((int(width*background.width), int(height*background.height)), PIL.Image.LANCZOS) # 4-tuple defining the left, upper, right, and lower pixel corners # since we usually define this from lower left but images are from upper # left the proper position is 1-height-ypos pos = [int(position[0]*background.width),int((1-position[1]-height)*background.height)] background.paste(foreground, pos, foreground) background.save(outfile)return outfileif __name__ =='__main__':print('*'*10, 'HELP for overlayimage', '*'*10)print('Put another picture into one that already exists')print('Outputfile is by default the same and position is 20%','and starts from lower left corner but can be adjusted as needed')
The idea is to enhance your graph with a logo or icon that portrays better for what is shown, e.g. insert an animal or similar instead of just text for you tickmarks. While this could be done manually, that feels too tedious if you have to do it many times. As this utility edits saved images, it uses PIL to handle the opening/closing/adding the image.
The usage is relatively straightforward, pass in the two filenames, first the one that is the image to be overlain and second the existing image. If you are certain the placement (whatever you enter for the position, default 10% from top and 10% from left as this is in image coordinates) is fine, you can overwrite the file in place (outfile=’same’). I recommend trying out first what you want to add where. Ideally, this utility is either combined with images that all have the same layout or you get the position directly from a script where you create your images.
Generally, the aspect of the image to be overlain is kept the same and the width is scaled accordingly but this can also be changed via keyword. Hope this helps someone out there.
TL;DR; The below code can be added as a script to your page to implement a touchdown event detection and directly attach it to a “menu” element
asyncfunctionswipedetect(el, callback, threshold=50, minimumTime=150, allowedTime=2000){var touchsurface = el, swipedir, startX, startY, distX, distY, threshold = threshold, //required min distance traveled to be considered swipe in X// restraintX = restraintX, // maximum distance allowed at the same time in perpendicular direction in X// thresholdY = thresholdY, //required min distance traveled to be considered swipe in Y// restraintY = restraintY, // maximum distance allowed at the same time in perpendicular direction in Y minimumTime = minimumTime, // maximum time allowed to travel that distance allowedTime = allowedTime, // maximum time allowed to travel that distance elapsedTime, startTime, handleswipe = callback ||function(swipedir){} touchsurface.addEventListener('touchstart', function(e){var touchobj = e.changedTouches[0] swipedir ='none' dist =0 startX = touchobj.pageX startY = touchobj.pageY startTime =newDate().getTime() // record time when finger first makes contact with surface// e.preventDefault() }, false) touchsurface.addEventListener('touchmove', function(e){ e.preventDefault() // prevent scrolling when inside DIV }, false) touchsurface.addEventListener('touchend', function(e){var touchobj = e.changedTouches[0] distX = touchobj.pageX - startX; // get horizontal dist traveled by finger while in contact with surface distY = touchobj.pageY - startY; // get vertical dist traveled by finger while in contact with surface dist = distY * distY + distX * distX; dist = Math.sqrt(dist); elapsedTime =newDate().getTime() - startTime; // get time elapsed// calculate the angle of the movement angle = (Math.atan2(distY, distX) / Math.PI*180)// convert angle to a sector of the movement// offsetting it by 45 degreees to get the movement easier.// and ensuring its positive sector = (angle +45+360) %360; sector = Math.floor(sector/90);if (elapsedTime >= minimumTime && elapsedTime <= allowedTime && dist >= threshold){ // first condition for a swipe metswitch (sector) {case0: swipedir ="right"; break;case1: swipedir ="up"; break;case2: swipedir ="left"; break;case3: swipedir ="down"; break; } }handleswipe(swipedir)if (dist >= threshold) { e.preventDefault() } }, false)}asyncfunctionswipe_enable(elementid='menu', table={'right':'a', 'up':'w', 'left':'d', 'down':'s', 'none':null}) {var el = document.getElementById(elementid);if (el) {swipedetect(el, asyncfunction(swipedir){//swipedir contains either "none", "left", "right", "top", or "down"let key = table[swipedir]; document.dispatchEvent(newKeyboardEvent('keypress', {'key': key})); }) }}
Handling a touchdown event via vanilla JS is nothing new, and I also took the initial implementation from a website I cannot find anymore. The structure was similar to this gist and the related discussion, as in initially I simply added a touchdown but the detection of right/left/up/down was patchy until I also added the direction sector. Additionally, I did not want to attach it all the time to each element etc. but instead added another function that handles the attaching.
Now I can simply have the above in a js-lib file and source it on our data visualisation page, then call swipe_enable() in the doc.ready function and be certain that swiping is handled on the corresponding element (with selects in this case). This makes usage of the page far easier on mobile devices; highly relevant if you are in the field like in CLOUDLAB and your phone is the only thing available due to the windy/rainy/snowy weather.
Extract the single frames of a GIF to repurpose them (for example to create a video) with the below code. As always, the most up-to-date version can be found in the GitHub gist
def gif2imgs(file, save=False, outpath='same', outfilename='same', ):""" Extract image array from a GIF file. Based on PIL, frames of a GIF file are extracted to a numpy array. If more than one frame is present in the GIF, a list of numpy arrays is returned. It is possible to save the images directy, by defaultin the same path astheGIFandthesamebasename. Parameters---------- file : str The GIF file containing one or more image frames. save : bool, optional Whether to save the image frames directy. The default is False, i.e. the functionreturnsalistoftheimageframesasseperatenumpyarraysoutpath : str, optionalWheretosavetheextractedimageframes.Thedefaultis 'same', i.e. samefolderoutfilename : str, optionalHowtonametheextractedimageasfiles.Thedefaultis 'same', i.e. takingthebasenameandadding_frameXtoit. Ifastringispassed, thesamesuffixisaddedbutthebasenameistakenasthepassedinstring.Returns -------listofframesortwolists (offilenamesofextractedimageandimages)TheextractedframesfromtheGIFandifsavingwasturnedonalsothefilenamesofwrittenoutframes. """import PIL import numpyas np import os import matplotlib.image as img pilIm = PIL.Image.open(file) pilIm.seek(0) # Read all images inside images = [] try: while True: # Get imageas numpy array tmp = pilIm.convert() # Make without palette a = np.asarray(tmp) if len(a.shape) == 0: continue # Store, and next images.append(a) pilIm.seek(pilIm.tell()+1) except EOFError: pass if save: if outpath == 'same': outpath = os.path.dirname(file) + os.sep if outfilename == 'same': outfilename = os.path.basename(file) outfiles = [] for frameno, frame in enumerate(images): _ = outpath+outfilename.rstrip('.gif') + f'_frame{frameno}.png' img.imsave(_, frame, vmin=0, vmax=255) outfiles.append(_) return outfiles, images else: return imagesif __name__ == '__main__': import requests import matplotlib.pyplot as plt fileurl = 'https://gifdb.com/images/high/jumping-cat-typing-on-keyboard-2b15r60jnh8hn5sv.gif' response = requests.get(fileurl) filename = './example.gif' with open(filename, 'wb') as fo: fo.write(response.content) frames = gif2imgs(filename) plt.imshow(frames[0])
Recently I wanted to make a video for a talk. And that is where the trouble started.
Initially, I thought to place a video and GIF side by side. However, getting a synchronous playback was tricky because there are few to no control options for GIFs in most presentation software. As a result, I had to extract the frames from the GIF instead and had to convert them into a video. While I could do this with any of many online services I specifically needed a synchronised playback as the timing of the content needed to match. The code above does exactly these frame extractions and pairs up nicely with another utility, the img2vid (which converts image files to a video with a choosable frame rate.
Simply set the option to save the frames and then run the img2vid on the single images to make the video and you can use it with controls in your presentation software, be it PowerPoint, or anything else.
The above main part gets you an example GIF (it had to be a cat, right?) and shows you the first frame. Enjoy!