

TL;DR;
Get the census data (and more) from the Basler Atlas that are updated by the Statistisches Amt Basel. The up-to-date version can be found on my GitHub Gists. Don’t forget to add the data source, i.e. the Stat. Amt Basel when you use their data. – it is being added automatically to the “meta” part in the datacontainer (in addition to the URL, the name and short name of the dataset).
import datetime
headers = {'User-Agent': 'Mozilla/5.0'}
def data2csv(<em>data</em>,
<em>outpath</em>='./',
<em>prefix</em>='',
<em>suffix</em>='',
<em>filesep</em>='_',
<em>datasep</em>=',',
<em>ext</em>='.csv',
<em>quiet</em>=True,
):
import os
if isinstance(data, <em>dict</em>) and 'data' not in data.keys():
of = []
for key in data.keys():
_of = data2csv(data[key],
<em>outpath</em>=outpath,
<em>prefix</em>=prefix,
<em>filesep</em>=filesep,
<em>datasep</em>=datasep,
<em>ext</em>=ext,
<em>quiet</em>=quiet,
)
if isinstance(_of, <em>list</em>):
of += _of
else:
of.append(_of)
return of
outpath = os.path.expanduser(outpath)
filename = filesep.join([prefix,
data['meta']['theme'],
data['meta']['subtheme'],
_nivgeo2nicename(data['meta']['nivgeo']),
suffix,
])
filename = filename.lstrip(filesep).rstrip(filesep) + ext
os.makedirs(outpath, <em>exist_ok</em>=True)
if not quiet:
print('Saving as', outpath+filename)
with open(outpath+filename, 'w') as file_obj:
file_obj.writelines(datasep.join(data['header']) + '\n')
datalines = [datasep.join(map(lambda <em>x</em>: <em>str</em>(x), line))
for line in data['data']]
file_obj.writelines('\n'.join(datalines) + '\n')
return outpath+filename
def _get_topic_url():
url = 'https://www.basleratlas.ch/GC_listIndics.php?lang=de'
return url
def _get_data_url():
# used to be the first url at around 2018
# "https://www.basleratlas.ch/GC_ronds.php?lang=de&js=1&indic=bevstruk.alter0&nivgeo=wge&ts=1&serie=2015"
url = 'https://www.basleratlas.ch/GC_ronds.php'
url = 'https://www.basleratlas.ch/GC_indic.php'
return url
def _get_references_url():
# e.g. https://www.basleratlas.ch/GC_refdata.php?nivgeo=wbl&extent=extent1&lang=de
url = 'https://www.basleratlas.ch/GC_refdata.php'
return url
def get_ref_data(<em>nivgeo</em>, <em>slimmed</em>=True):
import requests
payload = {'nivgeo': nivgeo,
'lang': 'de', 'extent': 'extent1'}
refs = requests.get(_get_references_url(),
<em>params</em>=payload,
<em>headers</em>=headers)
refdata = refs.json()['content']['territories']
# contains the actual numbering in the main geographical administrative
# dataset that it can be linked against
if slimmed:
return refdata['libgeo'], refdata['codgeo']
else:
return refdata
def _replace_error_value(<em>value</em>, <em>error_value</em>, <em>replace_value</em>):
return replace_value if value <= error_value else value
def get_basler_atlas_data(<em>nivgeo</em>,
<em>theme</em>,
<em>subtheme</em>,
<em>year</em>,
<em>quiet</em>=True,
<em>error_value</em>=-9999,
<em>replace_value</em>=0,
<em>empty_value</em>='',
):
import requests
from requests.exceptions import JSONDecodeError
payload = _params2payload(nivgeo, theme, subtheme, <em>year</em>=year)
response = requests.get(_get_data_url(),
<em>params</em>=payload,
<em>headers</em>=headers)
if response.ok:
try:
data = response.json()['content']['distribution']
except JSONDecodeError:
print(f'issues with {response.url} and the payload {payload}')
return None, None
if not quiet:
print(f'Got data from {response.url}, transforming ...')
values = data['values']
if 'sortIndices' in data:
# reported values are to be sorted, usual case?
indices = data['sortIndices']
else:
# reported values are sorted already, usual case for Bezirk?
indices = range(len(values))
if isinstance(values, <em>dict</em>):
keys = <em>list</em>(values.keys())
indices = range(len(values[keys[0]]))
values = [[_replace_error_value(values[key][i],
error_value,
replace_value,
)
for key in keys]
for i in sorted(indices)
]
data = values
return keys, data
else:
data = [<em>str</em>(_replace_error_value(values[i],
error_value,
replace_value,
)
)
for i in sorted(indices)]
return None, data
else:
if not quiet:
print(f'Request for {payload} failed')
return None, None
def _nivgeo2map(<em>nivgeo</em>):
lookuptable = {'block': 'map5',
'wbl': 'map5',
'bezirk': 'map6',
'wbe': 'map6',
'viertel': 'map2',
'wvi': 'map2',
'gemeinde': 'map3',
'wge': 'map3',
# 'wahlkreis': 'map7',
# 'pwk': 'map7',
}
return lookuptable[nivgeo]
def _get_nivgeos():
return 'wbe', 'wvi', 'wge', 'wbl' # , 'pwk'
def _nicename2nivgeo(<em>nivgeo</em>=None):
nicenames = _nivgeo2nicename(<em>nivgeo</em>=nivgeo)
if nivgeo is None:
return {v: k for k, v in nicenames.items()}
else:
return {nicenames: nivgeo}
def _nivgeo2nicename(<em>nivgeo</em>=None):
names = {'wbe': 'bezirk',
'wvi': 'viertel',
'wge': 'gemeinde',
'wbl': 'block',
# 'pwk': 'wahlkreis',
}
if nivgeo is None:
return names
else:
return names[nivgeo]
def _params2payload(<em>nivgeo</em>,
<em>theme</em>,
<em>subtheme</em>,
<em>year</em>=None):
payload = {'lang': 'de',
'dataset': theme,
'indic': subtheme,
'view': _nivgeo2map(nivgeo),
}
if year is not None:
payload['filters'] = 'jahr='+<em>str</em>(year)
return payload
def get_basler_atlas(<em>start_year</em>=1998,
<em>end_year</em>=datetime.date.today().year,
# population has different ages,
# men m , women w and a grand total
<em>themes</em>={'bevstruk': ['alter0',
'alter20',
'alter65',
'w',
'm',
'gesbev'],
'bevheim': ['anteil_ch',
'anteil_bs',
'anteil_al',
'anteil_bsanch',
# "gesbev" has been replaced by
'gesbev_f',
],
'bau_lwg': ['anzahl_lwg',
],
},
<em>geographical_levels</em>='all',
<em>error_value</em>=-9999,
<em>replace_value</em>=0,
<em>testing</em>=False,
<em>quiet</em>=True,
):
_nicenames = _nicename2nivgeo()
if geographical_levels == 'all':
nivgeos = _get_nivgeos()
else:
if isinstance(geographical_levels, <em>str</em>):
geographical_levels = [geographical_levels]
_nivgeos = _get_nivgeos()
nivgeos = [i if i in _nivgeos else _nicenames[i]
for i in geographical_levels]
assert all([i in _nivgeos or i in _nicenames
for i in nivgeos])
# the defaults that we know of - there is wahlbezirke too on the
# atlas but we don't particularly care about that one...
data = {}
# mapping of information from topic url to meta information entries
info2meta = {'url': 'c_url_indicateur',
'name': 'c_lib_indicateur',
'short_name': 'c_lib_indicateur_court',
'unit': 'c_unite',
'source': 'c_source',
'description': 'c_desc_indicateur',
}
for nivgeo in nivgeos:
refname, refnumber = get_ref_data(nivgeo)
refdata = [[_refname, _refnumber]
for _refname, _refnumber in zip(refname, refnumber)]
# ids of the nivgeo is in refdata['codgeo']
# names of the nivgeo is in refdata['libgeo']
nicename = _nivgeo2nicename(nivgeo)
for theme in themes:
if not quiet:
print(f'Working on {theme} for {_nivgeo2nicename(nivgeo)}')
for subtheme in themes[theme]:
if not quiet:
print(f'Working on {theme}.{subtheme} for ',
f'{_nivgeo2nicename(nivgeo)}')
# force a copy of refdata otherwise we keep updating the old list of lists.
container = {'data': [i.copy() for i in refdata],
'meta': {'theme': theme,
'nivgeo': nivgeo,
'subtheme': subtheme,
'theme': theme, },
'header': ['referencename', 'referencenumber'],
}
topicinfo = get_basler_atlas_topics(<em>theme</em>=theme,
<em>subtheme</em>=subtheme,
<em>fullinfo</em>=True)
for key, value in info2meta.items():
container['meta'][key] = topicinfo[theme][subtheme][value]
# values will be nested, adjust header line with extra
for year in range(start_year, end_year+1):
if not quiet:
print(f'Getting data for {year} for {theme}',
f'{subtheme} for {_nivgeo2nicename(nivgeo)}')
keys, thisdata = get_basler_atlas_data(nivgeo,
theme,
subtheme,
year,
<em>quiet</em>=quiet,
)
if thisdata is None:
if not quiet:
print(f'Failure to get data for {year} for {theme}',
f'{subtheme} for {_nivgeo2nicename(nivgeo)}')
thisdata = [''] * len(container['data'])
if keys is None:
container['header'] += [f'{year}']
else:
container['header'] += [f'{year}_{key}'
for key in keys]
for i, value in enumerate(thisdata):
if not isinstance(value, <em>list</em>):
value = [value]
container['data'][i] += value
if testing:
break # year
data[nicename+'_'+theme+'_'+subtheme] = container
if testing:
break # specific theme
if testing:
break # theme
if testing:
break # nivgeo
return data
def get_basler_atlas_topics(<em>theme</em>=None,
<em>subtheme</em>=None,
<em>fullinfo</em>=False):
import requests
if subtheme is not None and isinstance(subtheme, <em>str</em>):
subtheme = [subtheme]
payload = {"tree": "A01", 'lang': 'de'}
if theme is not None:
payload['theme'] = theme
response = requests.get(_get_topic_url(),
<em>params</em>=payload,
<em>headers</em>=headers)
topiclist = response.json()['content']['indics']
data = {}
for topicinfo in topiclist:
maintopic, subtopic = (topicinfo['c_id_dataset'],
topicinfo['c_id_indicateur'])
if maintopic not in data:
if fullinfo:
data[maintopic] = {}
else:
data[maintopic] = []
if subtheme is not None and subtopic not in subtheme:
continue
if fullinfo:
data[maintopic][subtopic] = topicinfo
else:
data[maintopic] += [subtopic]
return data
if __name__ == '__main__':
print("""
Some example usages:
# get some information for the population for the years 200 to 2003
data = get_basler_atlas(end_year=2003,
start_year=2000,
themes={'bevheim': ['anteil_ch','anteil_bs', ]},
geographical_levels='wvi',
quiet=True)
# just get everything that is a predefined topic:
themes={'bevstruk': ['alter0',
'alter20',
'alter65',
'w',
'm',
'gesbev'],
'bevheim': ['anteil_ch',
'anteil_bs',
'anteil_al',
'anteil_bsanch',
# "gesbev" has been replaced by
'gesbev_f',
],
'bau_lwg': ['anzahl_lwg',
],
}
# limit just by years
data = get_basler_atlas(themes=themes, start_year=2000, end_year=2010)
# also save the data to csv files (by theme and subtheme)
data2csv(data)
# get some information regarding the available topics
themes = get_basler_atlas_topics()
""")In the years of 2014 to 2020 or so I was teaching “An introduction to Geoinformatics” at the University of Basel. As a starter, students were supposed to load data of the administrative units of Basel in the form of shapefiles into a GIS (ArcMap or QGIS, I gave support in both) and connect these with population data (age groups or similar). These data can be downloaded from the Statistisches Amt Basel, usually in the form of Excel sheets – which is doable for a GIS but not great to be used: Sometimes I even struggled with getting the right separator in the excel sheet to be automatically recognised for the later import (which is just one reason why I prefer QGIS). However, the updated numbers were sometimes published later than when I’d like to use them – even though the Basler Atlas already had them. So I went to work to scrape the data directly from this source, because I did not want to manually download the data each and every semester again and for several dataset individually. We can do better than that.
In the back, the Basler Atlas uses geoclip, a product from a French company (you also see their logo when opening the Atlas). Relevant for me was that with the browser inspect feature you can get the requests being made in the back and see where the data are coming from (you can of course also click on the request to see the direct answer)
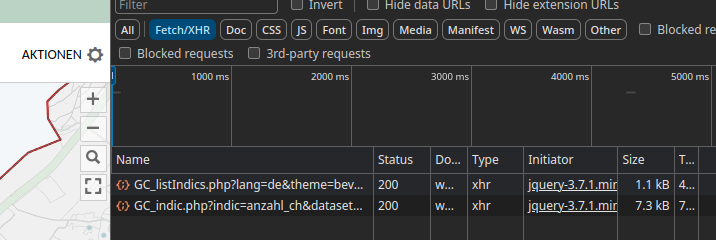
As you can see there is a listIndics and a indic API endpoint. ListIndics gives an overview of datasets, indic gives the data of the “indices”. Both require some specific payload to work, the most important being {‘lang’: ‘de’}. There is however a third endpoint that gives the crucial reference information, namely the name/id of the administrative feature at GC_refdata.php. Initially, I only used the indic endpoint to collect the data directly and the ref to get the reference frame. Combining requests to both, the data can be collected automatically, either to update or for the first time and come back in dict, including a headerline and meta information for the later export (also included above). Now you can get your up-to-date data from the Basler Atlas as well and have a better time using it for temporal analysis by running the above code and then calling this or something like this
data = get_basler_atlas(<em>geographical_levels</em>='block',
                        <em>themes</em>={'bevstruk': ['alter0',
                                             'alter20',
                                             'alter65',
                                             'w',
                                             'm',
                                             'gesbev'], },
<em>quiet</em>=True)This gives you the population data on the block level of the years from 1998 until today (2024 as of this writing). Calling the below saves the data to your home directory, namely 6 CSV files.
data2csv(data, <em>outpath</em>='~/')Today I extended the code above to also get the available topics (i.e. the categories). Which allows us to discover topics or download data that would require some time to find otherwise.
geolevel = 'block'

for key, values in topics.items():
    if key != 'bevstruk':
        continue
    data = get_basler_atlas(<em>themes</em>={key: values},
                         <em>quiet</em>=True,
                         <em>geographical_levels</em>=geolevel)
    of = data2csv(data, <em>outpath</em>='~/')
breakAs always, I hope this helps someone to discover data or save some time for themselves. And maybe at some point, I’ll find the time to document everything a bit better. Don’t forget to add the data source, i.e. the Stat. Amt Basel when you use their data.
Update/Fix
As I noticed today, there was some issue with the previous version of this script, namely a “deepcopy” issue that led to the fact, that the datacontainer had data from all connected subthemes when more than one was requested. Ups. But it should be fine now, the gist on top is updated and some usage information is added as well. 🙂